
Microsoft Excel for Business Advanced:
 Data Analysis, Dashboards and Business Reporting
Develop advanced Excel skills in a focused live online course covering advanced formulas, data analysis, PivotTables, PivotCharts, dashboards, Power Query, business reporting, and AI-assisted workflows.
Course Overview
The Microsoft Excel for Business Advanced course is a live online certificate course designed for students and professionals who already understand Excel fundamentals and want to develop stronger skills in data analysis, reporting, automation, and business decision-making.
Students learn how to use advanced formulas, organize and clean complex datasets, create PivotTables and PivotCharts, build interactive dashboards, apply What-If Analysis, and use Power Query to improve data preparation workflows. The course also integrates AI-assisted tools to support formula development, data interpretation, reporting, and productivity while emphasizing accuracy, verification, and professional judgment.

Who This Course Is For
This course is designed for students and professionals who already have basic Excel experience and want to develop more advanced skills for business analysis, reporting, data management, and decision-making. It is ideal for office professionals, administrative staff, managers, analysts, entrepreneurs, students, and job seekers who regularly work with spreadsheets and want to become more efficient, accurate, and confident using advanced Excel tools.
Students should be comfortable entering and formatting data, creating basic formulas, using common functions, and working with tables, sorting, filtering, and charts. The course is rigorous and hands-on, with a strong focus on applied business workflows and practical problem-solving.
Learning Outcomes
By the end of this course, students will be able to:
- Use advanced formulas and functions to solve complex business problems.
- Apply XLOOKUP, INDEX and MATCH, logical functions, text functions, date functions, and error-handling techniques.
- Clean, organize, and transform business data using advanced Excel tools and Power Query.
- Create PivotTables and PivotCharts to summarize, compare, and analyze large datasets.
- Build interactive dashboards using charts, slicers, timelines, and key performance indicators.
- Apply What-If Analysis, Goal Seek, and forecasting tools to support business planning and decision-making.
- Create professional business reports that communicate trends, results, and recommendations clearly.
- Use AI tools to develop formulas, troubleshoot errors, interpret data, and improve reporting while critically reviewing all AI-generated results.
- Prepare advanced Excel workbooks that are accurate, efficient, organized, and suitable for professional use.

What You Will Create
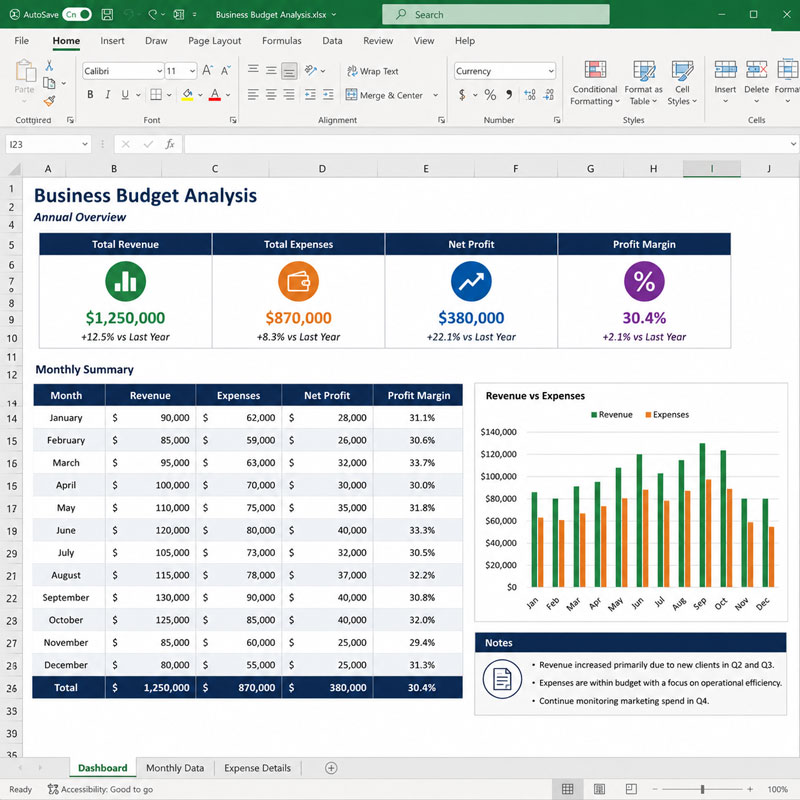
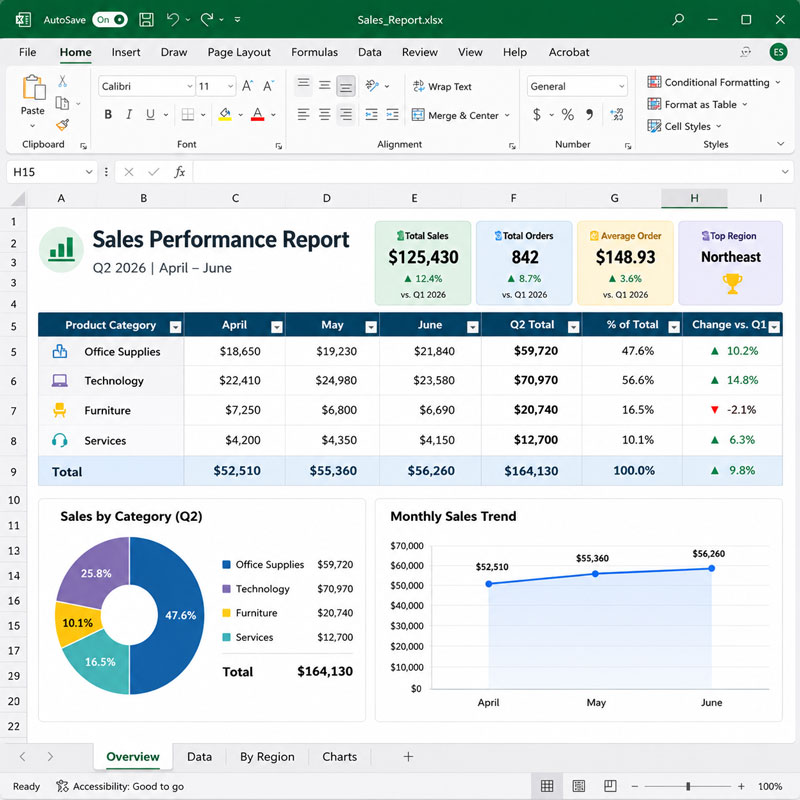
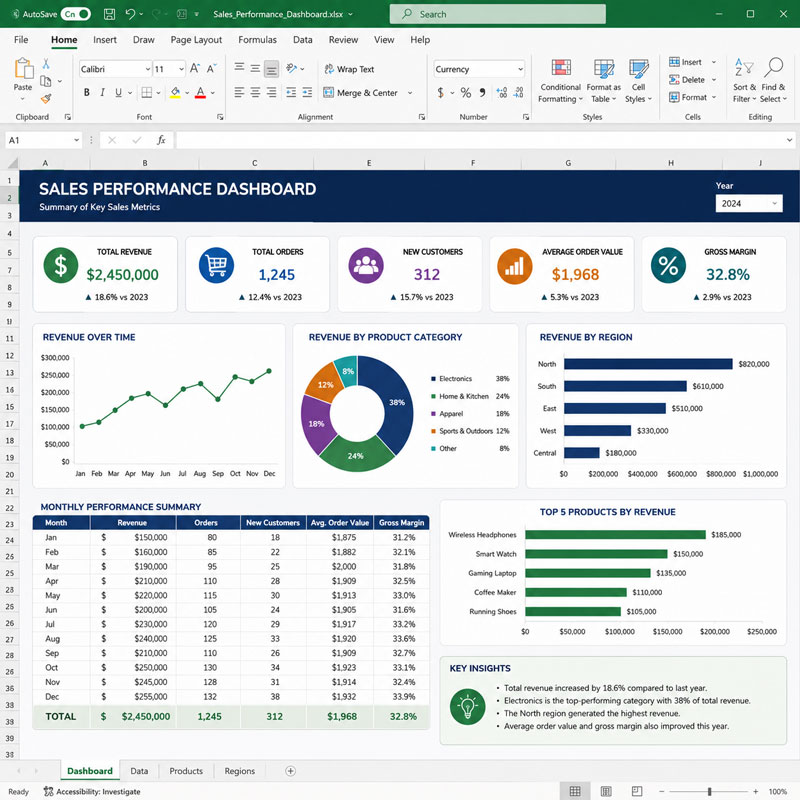
Throughout the course, students complete advanced exercises and business-focused projects designed to strengthen their ability to analyze data, build reports, and support professional decision-making. By the end of the course, students will have created:
- Advanced formula-driven business worksheets
- Cleaned and transformed datasets using Power Query
- PivotTables and PivotCharts for business analysis
- Interactive dashboards with slicers, timelines, and key performance indicators
- What-If Analysis and forecasting models
- Automated reporting workflows
- Professional business reports with data insights and recommendations
- A final advanced Excel project demonstrating data analysis, dashboard development, reporting, and AI-assisted workflows
Examples of Classwork
Course Structure
This course includes 12 hours of live online instruction delivered either as four 3-hour sessions or two 6-hour Saturday sessions. Classes combine instructor demonstrations, guided practice, hands-on exercises, feedback, and project-based learning focused on advanced Excel workflows for business analysis, reporting, and decision-making.
Each module introduces advanced spreadsheet skills and includes applied exercises designed to help students work with complex formulas, clean and transform data, create PivotTables and dashboards, and develop professional reports. Students who successfully complete the full course and final project earn the SOLOVANT Microsoft Excel for Business Advanced Certificate, demonstrating applied skills in data analysis, business reporting, dashboard development, Power Query, and AI-assisted Excel workflows.
Session 1: Advanced Formulas and Business Calculations
(3 Hours)
The first session introduces advanced formulas and functions used to solve complex business problems. Students learn how to combine functions, manage different types of cell references, retrieve information from large datasets, and build formulas that are accurate, efficient, and easier to maintain.
Topics Covered
- Review of relative, absolute, and mixed cell references
- Nested formulas and function combinations
- Logical functions, including IF, IFS, AND, and OR
- Lookup functions, including XLOOKUP
- INDEX and MATCH
- SUMIF, SUMIFS, COUNTIF, COUNTIFS, and AVERAGEIF
- Text and date functions
- Dynamic array functions, including FILTER, SORT, and UNIQUE
- Error handling with IFERROR
- Formula auditing and troubleshooting
- Using AI to generate, explain, and debug advanced formulas
Module Project
Students will create an advanced sales and performance analysis worksheet using lookup, logical, conditional, text, and dynamic array functions. The project includes retrieving data, applying business rules, identifying performance results, and troubleshooting formulas with AI-assisted support.
Session 2: Data Management and Power Query
(3 Hours)
The second session focuses on preparing and managing business data for analysis. Students learn how to clean, organize, transform, and validate datasets while improving efficiency through Excel’s advanced data tools and an introduction to Power Query.
Topics Covered
- Working with advanced Excel Tables
- Data cleaning techniques
- Removing duplicates and handling missing data
- Text-to-Columns
- Flash Fill and advanced data formatting
- Advanced sorting and filtering
- Data validation and input controls
- Introduction to Power Query
- Importing and transforming data
- Refreshing and managing data connections
- Using AI to clean, organize, and prepare datasets
Module Project
Students will clean and transform a raw business dataset using Excel’s data management tools and Power Query. The project includes importing data, correcting inconsistencies, validating entries, and preparing a structured dataset for reporting and analysis.
Session 3: PivotTables, Dashboards, and Business Reporting
(3 Hours)
The third session focuses on analyzing and presenting business data through PivotTables, PivotCharts, dashboards, and interactive reports. Students learn how to summarize large datasets, identify trends, and create professional reports that support business decision-making.
Topics Covered
- Creating and managing PivotTables
- Grouping and summarizing data
- Calculated fields and calculated items
- Creating PivotCharts
- Using slicers and timelines
- Building interactive dashboards
- Selecting effective business visualizations
- Key performance indicators (KPIs)
- Professional reporting best practices
- Using AI to interpret trends and generate business insights
Module Project
Students will create an interactive business dashboard using PivotTables, PivotCharts, slicers, and KPIs. The project demonstrates how to summarize large datasets, visualize key metrics, and present actionable insights through a professional reporting dashboard.
Session 4: Business Analysis, Forecasting, and Automation
(3 Hours)
The final session focuses on advanced analytical tools that support business planning and decision-making. Students learn how to model different business scenarios, forecast outcomes, automate reporting tasks, and complete a comprehensive business analysis project using professional Excel workflows and AI-assisted tools.
Topics Covered
- What-If Analysis
- Goal Seek
- Scenario Manager
- Financial and forecasting functions
- Introduction to forecasting tools
- Automating repetitive tasks
- Advanced workbook management
- Professional reporting and presentation
- AI-assisted business analysis and reporting
- Review and final project completion
Module Project
Students will develop a complete business analysis workbook that integrates advanced formulas, Power Query, PivotTables, dashboards, and forecasting tools to evaluate business performance and support decision-making. The final project demonstrates professional Excel skills through a polished, data-driven report enhanced with AI-assisted workflows.
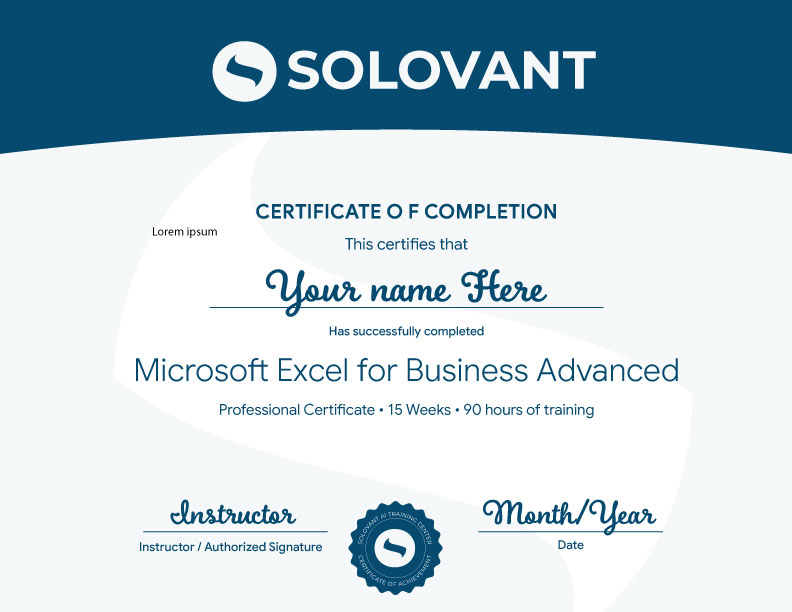
Certificate of Completion
Students who complete the course requirements will receive a SOLOVANT Microsoft Excel for Business Advanced Certificate.
The certificate reflects completion of a structured live online course focused on advanced formulas, data management, Power Query, PivotTables, dashboards, business reporting, forecasting, and AI-assisted Excel workflows.
Academic and Professional Teaching Model
SOLOVANT courses are designed for learners who want more than short tutorials or isolated software tips. This course follows a structured academic and professional approach that combines advanced technical demonstrations, guided practice, business-focused exercises, project-based learning, data interpretation, and instructor feedback.
Courses are taught by instructors with graduate-level education, university teaching experience, professional certifications, and experience in business software, technology, data analysis, productivity, and artificial intelligence.
The goal is to help students use Microsoft Excel as an advanced business analysis and reporting tool while developing the technical, analytical, and problem-solving skills needed to manage complex data, build dashboards, automate workflows, create forecasts, and support professional decision-making.
AI in Excel Workflows
Artificial intelligence is becoming an important part of advanced spreadsheet analysis, data preparation, reporting, forecasting, and business decision-making. In Excel, AI-supported tools can assist with complex formula development, formula debugging, data cleaning, Power Query steps, trend interpretation, dashboard planning, report summaries, and repetitive analytical tasks.
This course introduces AI as a professional support tool, not as a replacement for advanced Excel knowledge, analytical thinking, or business judgment. Students learn how to use AI strategically while maintaining control over data quality, formulas, calculations, reporting logic, forecasts, and final recommendations.
The course also develops critical awareness of AI limitations, including incorrect formulas, misleading interpretations, unsupported conclusions, privacy concerns, inconsistent outputs, and the need to verify all AI-generated results before using them in professional reports or business decisions.
Tuition:
Normal $490
Summer Sale $360
What is included:
- SOLOVANT Microsoft Excel for Business Advanced Certificate
- 12 hours of live online instruction in 4 sessions
- Microsoft Certified or industry-experienced instructor
- Graduate-level professor
- Free class retake
- Class recordings
- 25% discount on your next SOLOVANT course
- One-on-one mentoring included
Schedule
- Duration: 4 sessions
- Total Instruction: 12 hours
- Format: Live online
-
Weeknights class option:
Nov 17, 19th, and Dec 3 and 5th - Time: 6:00 pm to 9:00 PM
-
Saturday class option:
Nov 21 and Dec 5th - Time: 10:00 AM to 4:30 PM
-
Sale!
Ready to Build Strong Graphic Design Foundations?
Enroll in this live online course and develop advanced Microsoft Excel skills through guided demonstrations, hands-on exercises, instructor feedback, and business-focused projects.
This course includes structured training in advanced formulas, lookup functions, data cleaning, Power Query, PivotTables, PivotCharts, dashboards, What-If Analysis, forecasting, business reporting, and AI-assisted Excel workflows. Students complete a final advanced business analysis project and earn the SOLOVANT Microsoft Excel for Business Advanced Certificate upon successful completion.
-
Sale!
Ready to Build Strong Graphic Design Foundations?
Enroll in this live online course and develop advanced Microsoft Excel skills through guided demonstrations, hands-on exercises, instructor feedback, and business-focused projects.
This course includes structured training in advanced formulas, lookup functions, data cleaning, Power Query, PivotTables, PivotCharts, dashboards, What-If Analysis, forecasting, business reporting, and AI-assisted Excel workflows. Students complete a final advanced business analysis project and earn the SOLOVANT Microsoft Excel for Business Advanced Certificate upon successful completion.
Continue Into the Full Certificate Program
Students who complete this course may continue into the full Excel Certificate Program for Business

Earn Your Excel Certificate

If you have any questions, feel free to contact us
We can schedule a Zoom or Phone Call to answer all your questions
hello@solovant.com